The Ripple Effect: A New Dawn for XRP
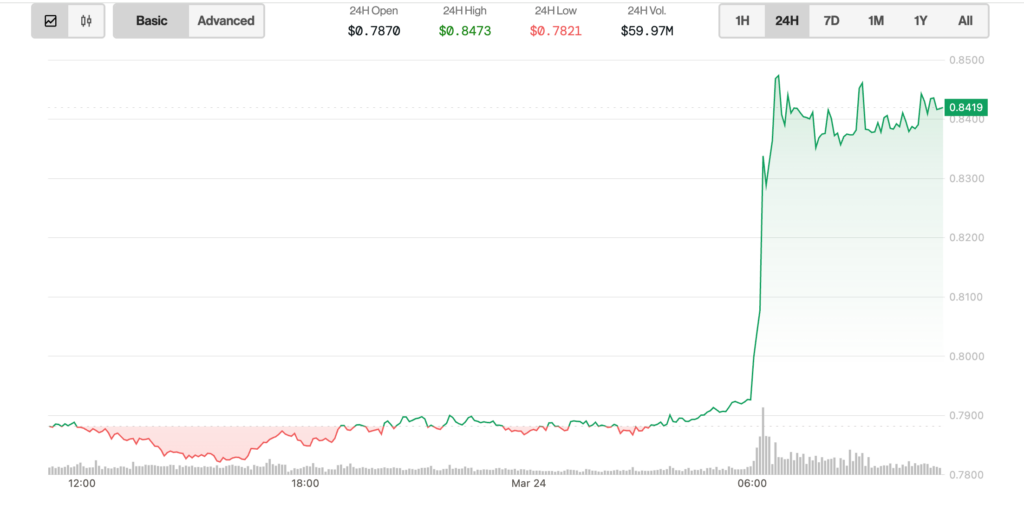
XRP is currently experiencing a bullish momentum following the recent announcement that the U.S. Securities and Exchange Commission (SEC) has dropped its protracted lawsuit against Ripple Labs. This pivotal development marks a significant turning point for the cryptocurrency, igniting optimism among investors and analysts alike.
Future Price Predictions: Aiming for $10 by 2030
In light of this newfound regulatory clarity, analysts are forecasting that XRP could potentially reach $10 by the year 2030. This optimistic outlook is driven by several key factors, including the anticipated adoption of Ripple’s RLUSD stablecoin and the possibility of Ripple Labs pursuing an Initial Public Offering (IPO).
Ryan Lee, an analyst at Bitget, emphasized the importance of XRP’s current trading range, noting that a breakout from the existing levels of $2.35 to $2.55 could set the stage for significant price movements. “Short-term price targets indicate a range from $2.00-$2.17 on the downside to $2.65-$3.00 on the upside,” Lee explained. He added that long-term forecasts could see XRP climbing to between $4.20 and upwards of $10 by 2030, contingent on Ripple successfully capitalizing on payment adoption trends.
Key Levels to Watch: The $2.50 Benchmark
Lee also highlighted that the $2.50 mark will be critical to monitor for any imminent breakout or breakdown. He projected a medium-term price range of $1.50-$5.89, influenced by the SEC’s withdrawal and the potential approval of an XRP-based Exchange-Traded Fund (ETF). However, technical indicators such as a neutral Relative Strength Index (RSI) and a bearish Moving Average Convergence Divergence (MACD) suggest that XRP may be in a consolidation phase for the time being.
Understanding Technical Indicators
To better grasp the market sentiment surrounding XRP, it’s essential to understand some key technical indicators. The Relative Strength Index (RSI) is a momentum indicator that gauges the speed and change of price movements on a scale from 0 to 100. It helps identify overbought (above 70) or oversold (below 30) conditions.
On the other hand, the Moving Average Convergence Divergence (MACD) is a trend-following indicator that reveals the relationship between two moving averages of a security’s price. Signal line crossovers within the MACD can indicate shifts in bullish or bearish momentum, providing traders with additional insights.
Market Sentiment: A Bullish Outlook
Nick Ruck, the director at LVRG Research, remarked that the relative stability in XRP’s price action signifies a bullish sentiment among investors. “XRP has performed admirably during the recent cryptocurrency selloff and has the potential for continued upward movement, although external factors such as U.S. macroeconomic conditions and tariffs could pose challenges,” he cautioned.
In addition to these bullish indicators, discussions surrounding Ripple Labs’ potential IPO are gaining traction. CEO Brad Garlinghouse has indicated that an IPO is “possible,” further fueling investor enthusiasm and positioning XRP for a brighter future.
In conclusion, as XRP navigates this new landscape post-SEC case, the combination of regulatory clarity, potential stablecoin adoption, and IPO prospects positions it for significant growth in the coming years. Investors and analysts alike will be keenly watching XRP’s price movements as it aims for ambitious targets by 2030.


